by Kara Piarulli
I had the amazing opportunity to work with the National Center for Environmental Information(NCEI) this fall through an internship in order to obtain my Master’ s degree in Climate Change and Society from NCSU. I received my bachelor’s degree in meteorology from Millersville University in PA in May of 2016.
I knew since I was five years old that I wanted to pursue a career in weather. It all started with a thunderstorm with bright flashes of blue; this is what sparked my interest. Throughout college I would hear stories of how other students like myself became interested in meteorology, and their stories were very much the same. Originally, I wanted to get into broadcasting. I never knew at this young age that there are actually many different areas that meteorologists could work in.
Upon receiving my bachelor’s degree, I knew that I wanted to further my education and pursue careers in research/education. I decided to enroll in the CCS program at NCSU, and this experience has opened up so many doors for me. I will be receiving my degree from the university over the winter. I would like to share with you the process and some of the results from my internship project with NCEI.
This project was developed as climate/weather data lesson for high school teachers to use in their classroom. To test this lesson, I handed it off to several teachers in North Carolina to use mainly at the 9th grade level. The idea is to introduce the climate lesson after completing lessons in meteorology. The intro to this lesson addresses climate/weather terminology and includes video links that explain lesson objectives. The main goal of this lesson was to explore the connection between climate change and flash flood events in NC communities using NOAA NCEI climate data.

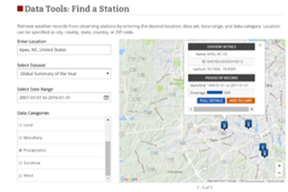
Downloading the data to create the final graphs from the NCEI website:<br />https://www.ncdc.noaa.gov/cdo-web/search?datasetid=GSOY
I provided step by step instructions with figures on how to download the data needed for students to follow from the NCEI website. This seems to have been too time consuming for a one day lesson. Thus, it is more appropriate to deliver the lesson over a period of two days. For a one day lesson, datasets can be downloaded the day before by the instructor and given to the students the following day.

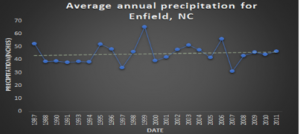
Ideal self-generated graph, spanning a data period of 30 years
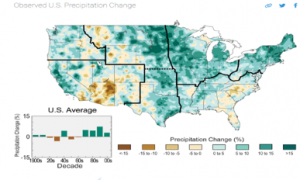
Students were expected to work in small groups and choose a NC town/city and create precipitation graphs for the last 30 years after exploring the area and determining that it has a history of frequent flash floods. These graphs are then compared to current results and future predictions in precipitation changes as shown in the latest National Climate Assessment. Is climate change responsible for flash floods at this regional level? Students provided to me their final graphs, and I also gathered some final results from teachers on their thoughts and advice for future implementation in schools.

making the connection to climate change via the above graph, via http://nca2014.globalchange.gov/highlights/report-findings/our-changing-climate


